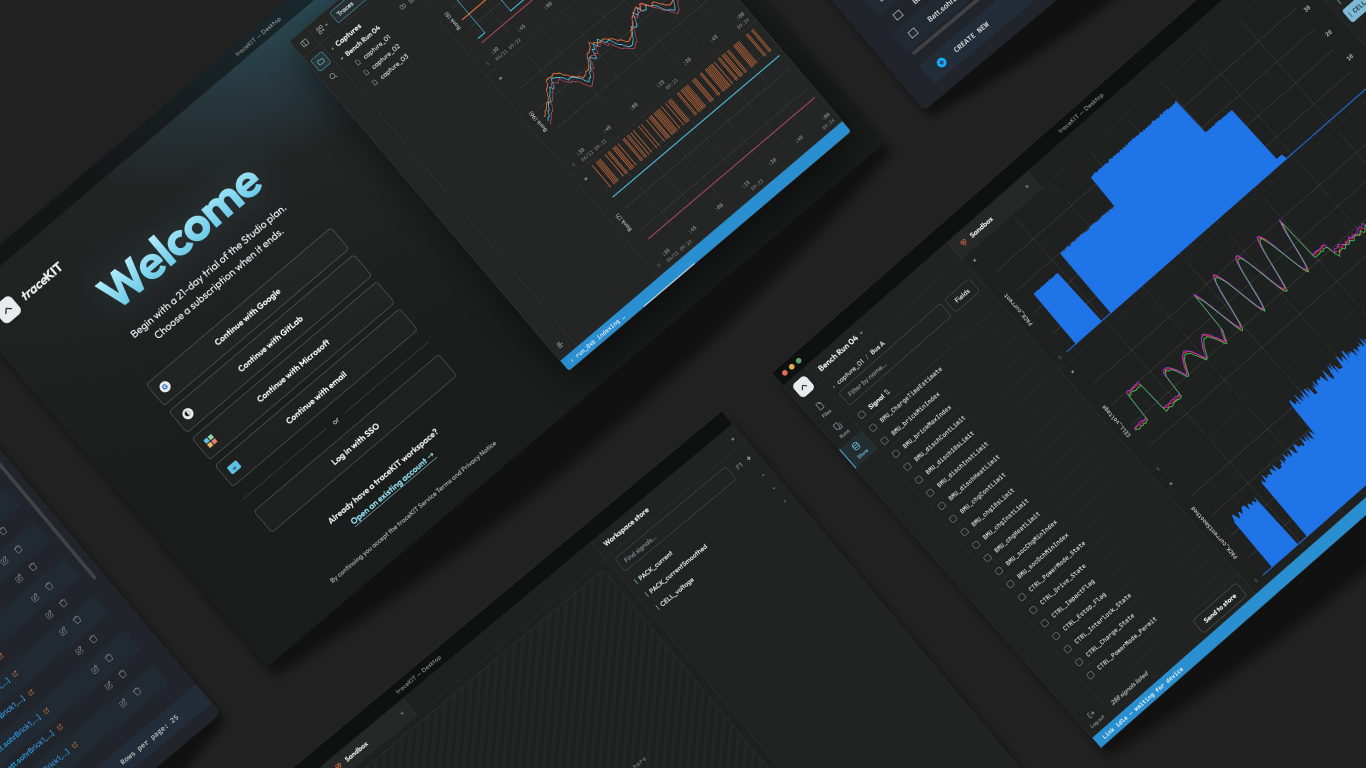
*A progression of enterprise and technical tools, including work under NDA (names and features anonymized where noted).
Company: Automotive Power
Project Type: Enterprise engineering tool
Role: Sole designer · Team of 5 (1 designer, 2 backend, 2 frontend engineers). Created and maintained a design system in Figma, working closely with frontend and backend engineers for a consistent experience. Defined user flows and information architecture using personas. Developed low-, mid-, and high-fidelity wireframes, mockups, and prototypes.
Overview
TraceKIT* is a hosted web application providing a suite of tools to organize, manage, explore, and interact with high-frequency physical-signal data using Extract, Transform, Load pipelines. I designed the interface end-to-end — from information architecture to a reusable design system to final UI — working directly with 4 engineers to ship a tool used daily by test and validation engineers.
The Problem
Engineers were relying on external, general-purpose signal analysis software — powerful, but heavyweight, expensive to license, and not tailored to our team's specific hardware and workflows. Hundreds of raw signal channels per capture needed to be found, compared, and scripted against, and the external tool's fixed IA meant fighting the tool as much as using it.
Key Design Decisions
- Purpose-built over purpose — scoped around actual daily engineer tasks
- Multi-track synchronized plotting with a shared time cursor
- Embedded IPython scripting alongside the visual workspace
- Dark, data-first visual language keeping data the focal point
- Design system as infrastructure, built early so engineers could ship consistently
Outcome
TraceKIT shipped and was in active-beta use when the company was acquired, which shifted priorities before longer-term adoption could be tracked. The redesign consolidated three previously separate workflows into one.
Transition out
When the company was acquired by Ford, this tool became the foundation for its next chapter.
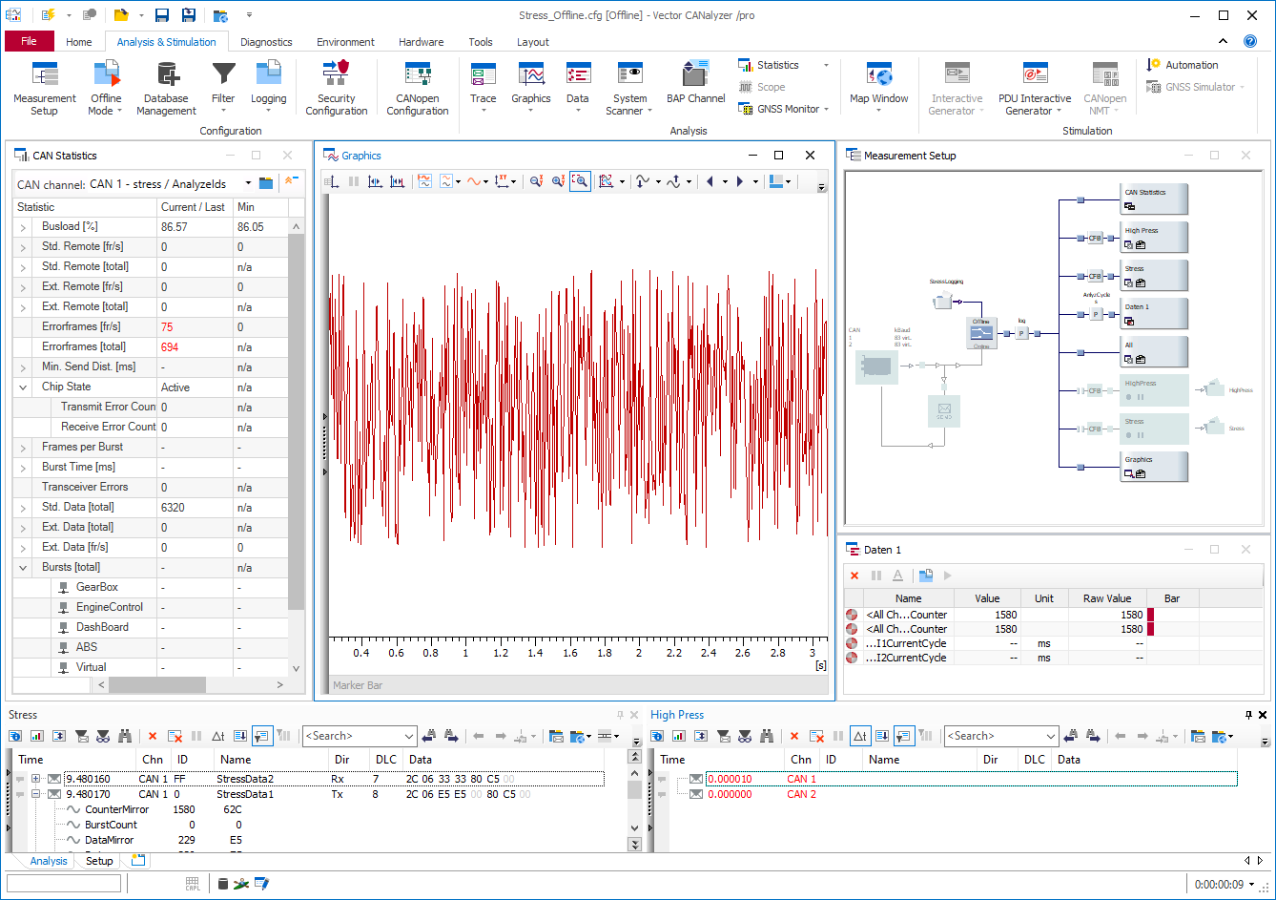
CANalyzer Tool (Vector Informatik) engineers use to debug and see data, displaying plots and signal view
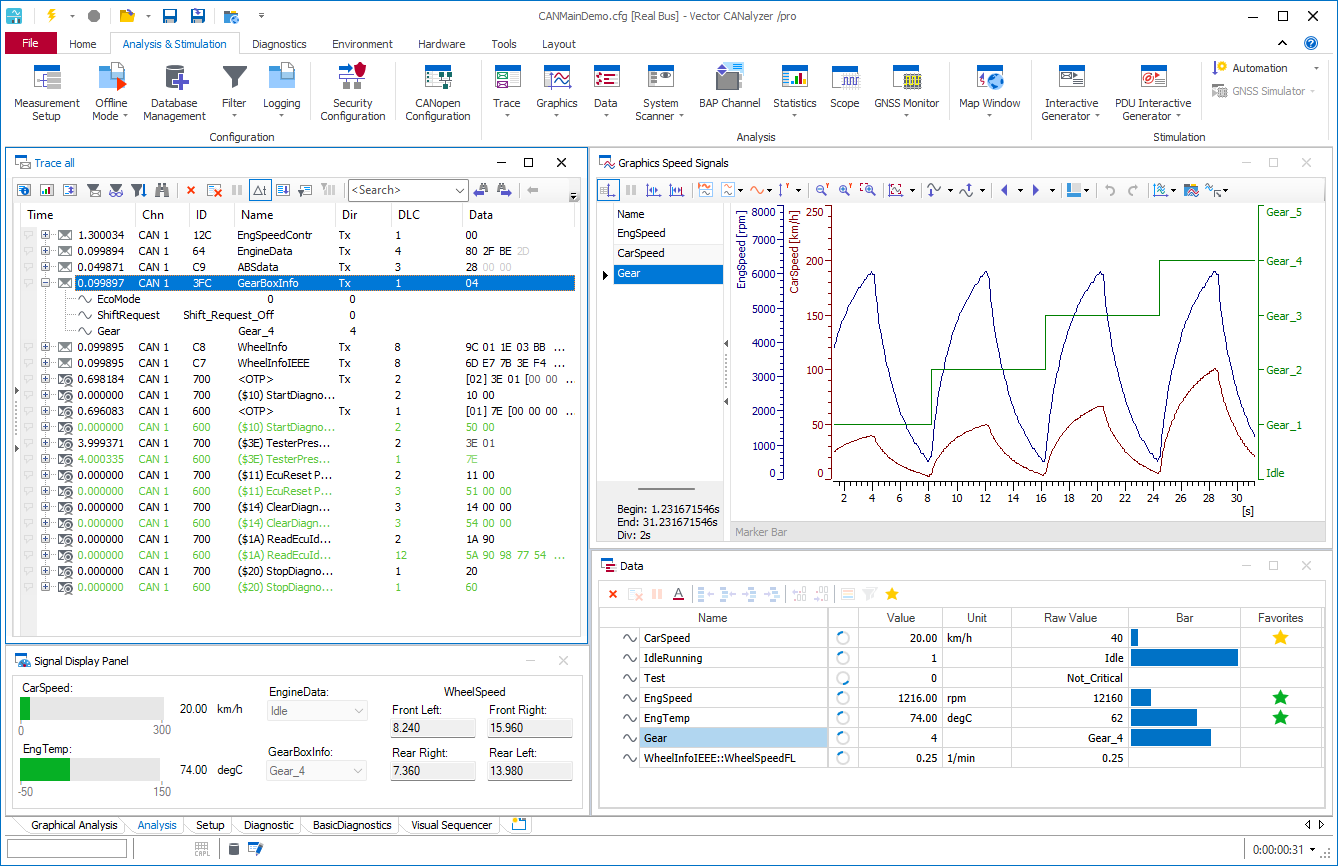
Another image of CANalyzer (Vector Informatik)
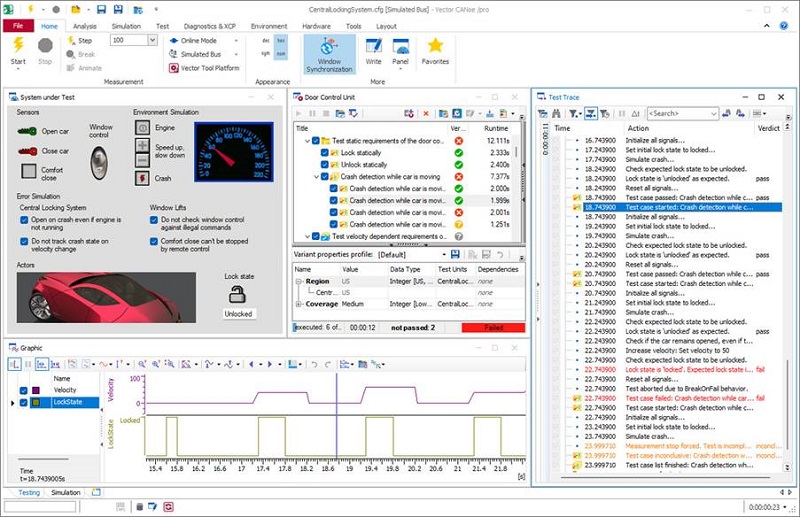
CANoe another complimentary tool in the Vector Informatik suite that engineers use
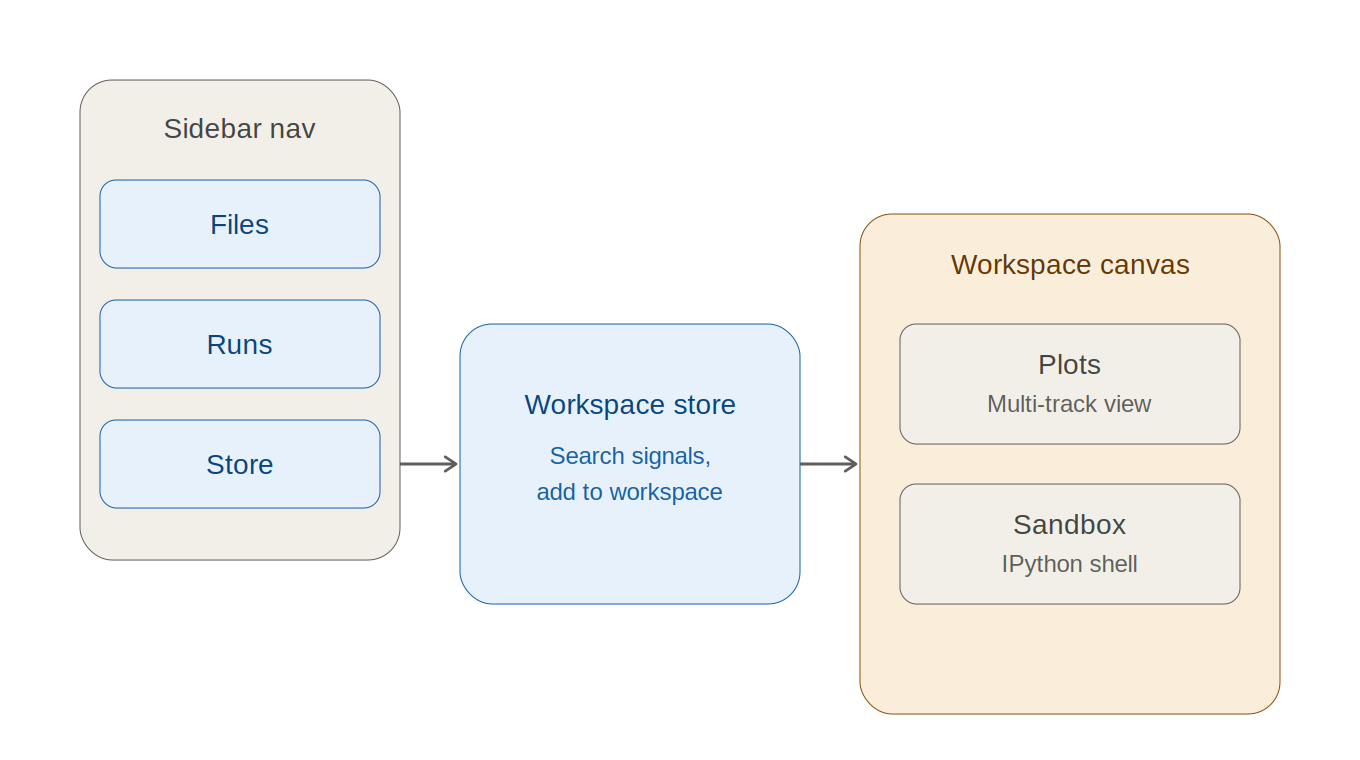
IA for traceKIT sidebar navigation (Files, Runs, Store) feeds a searchable workspace store, where selected signals flow into the workspace canvas — split between multi-track plotting and an embedded scripting sandbox.
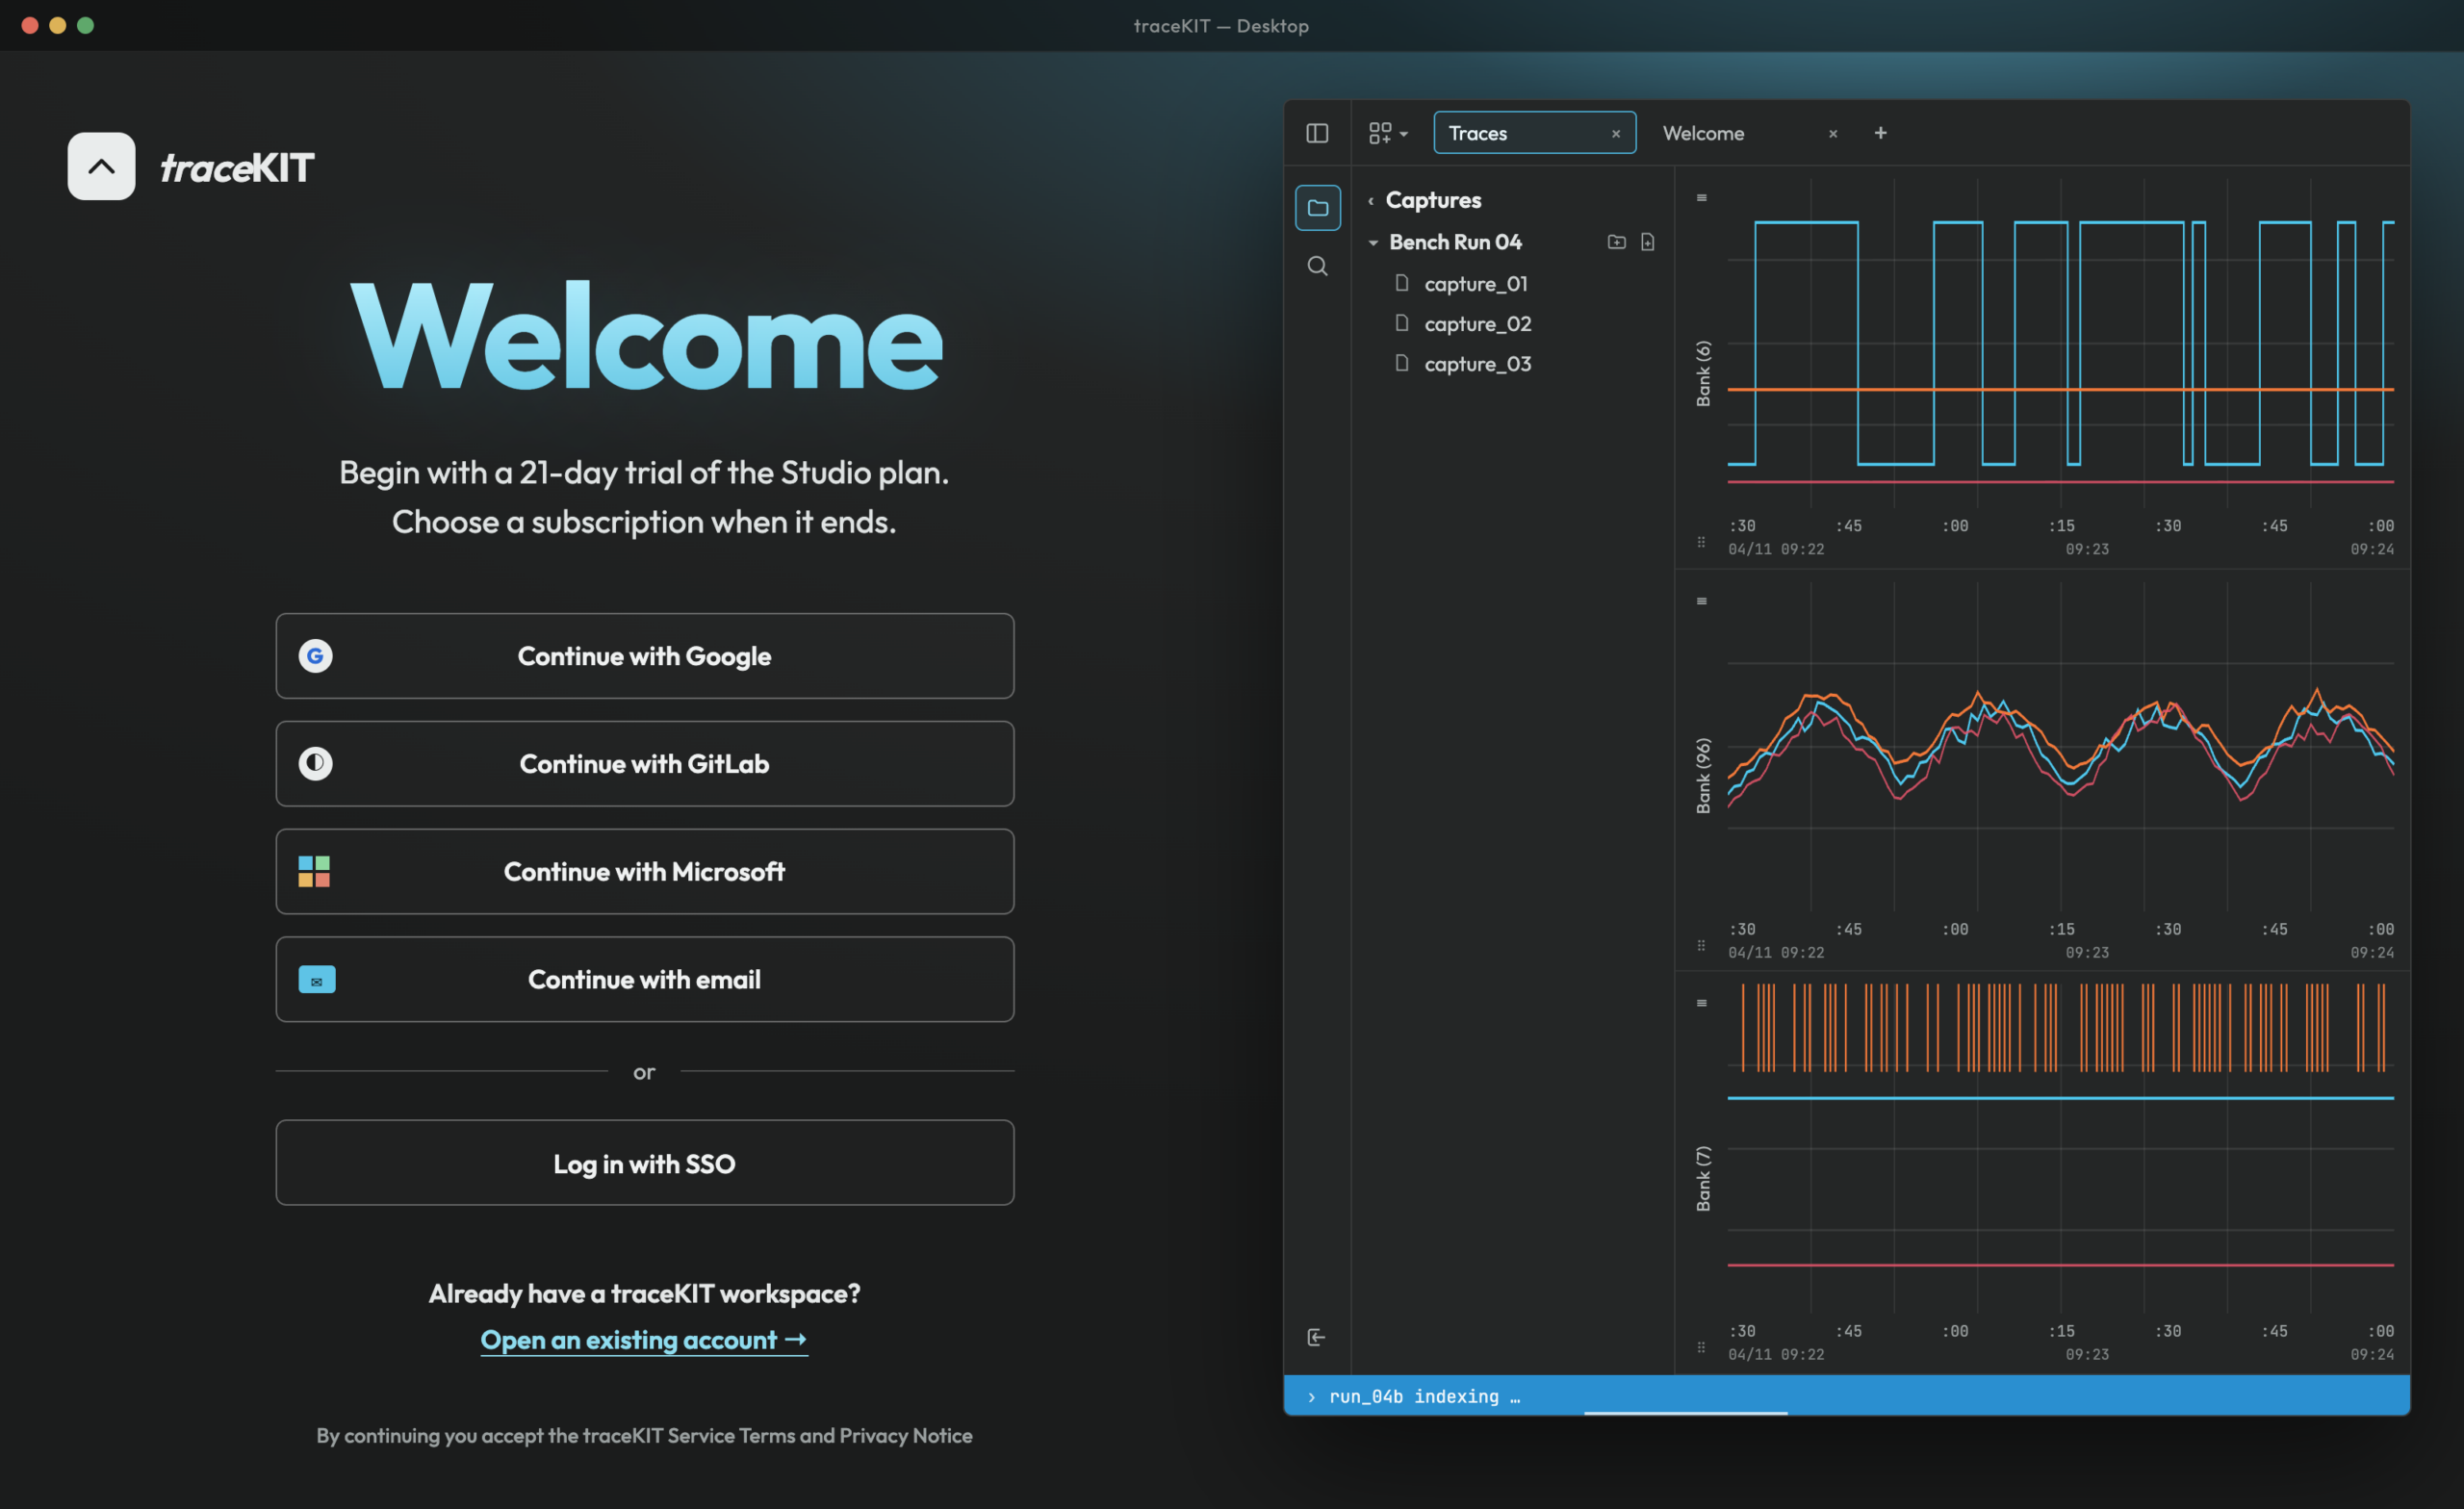
Welcome/onboarding — Auth and trial onboarding, designed to get engineers into their first capture with minimal friction.
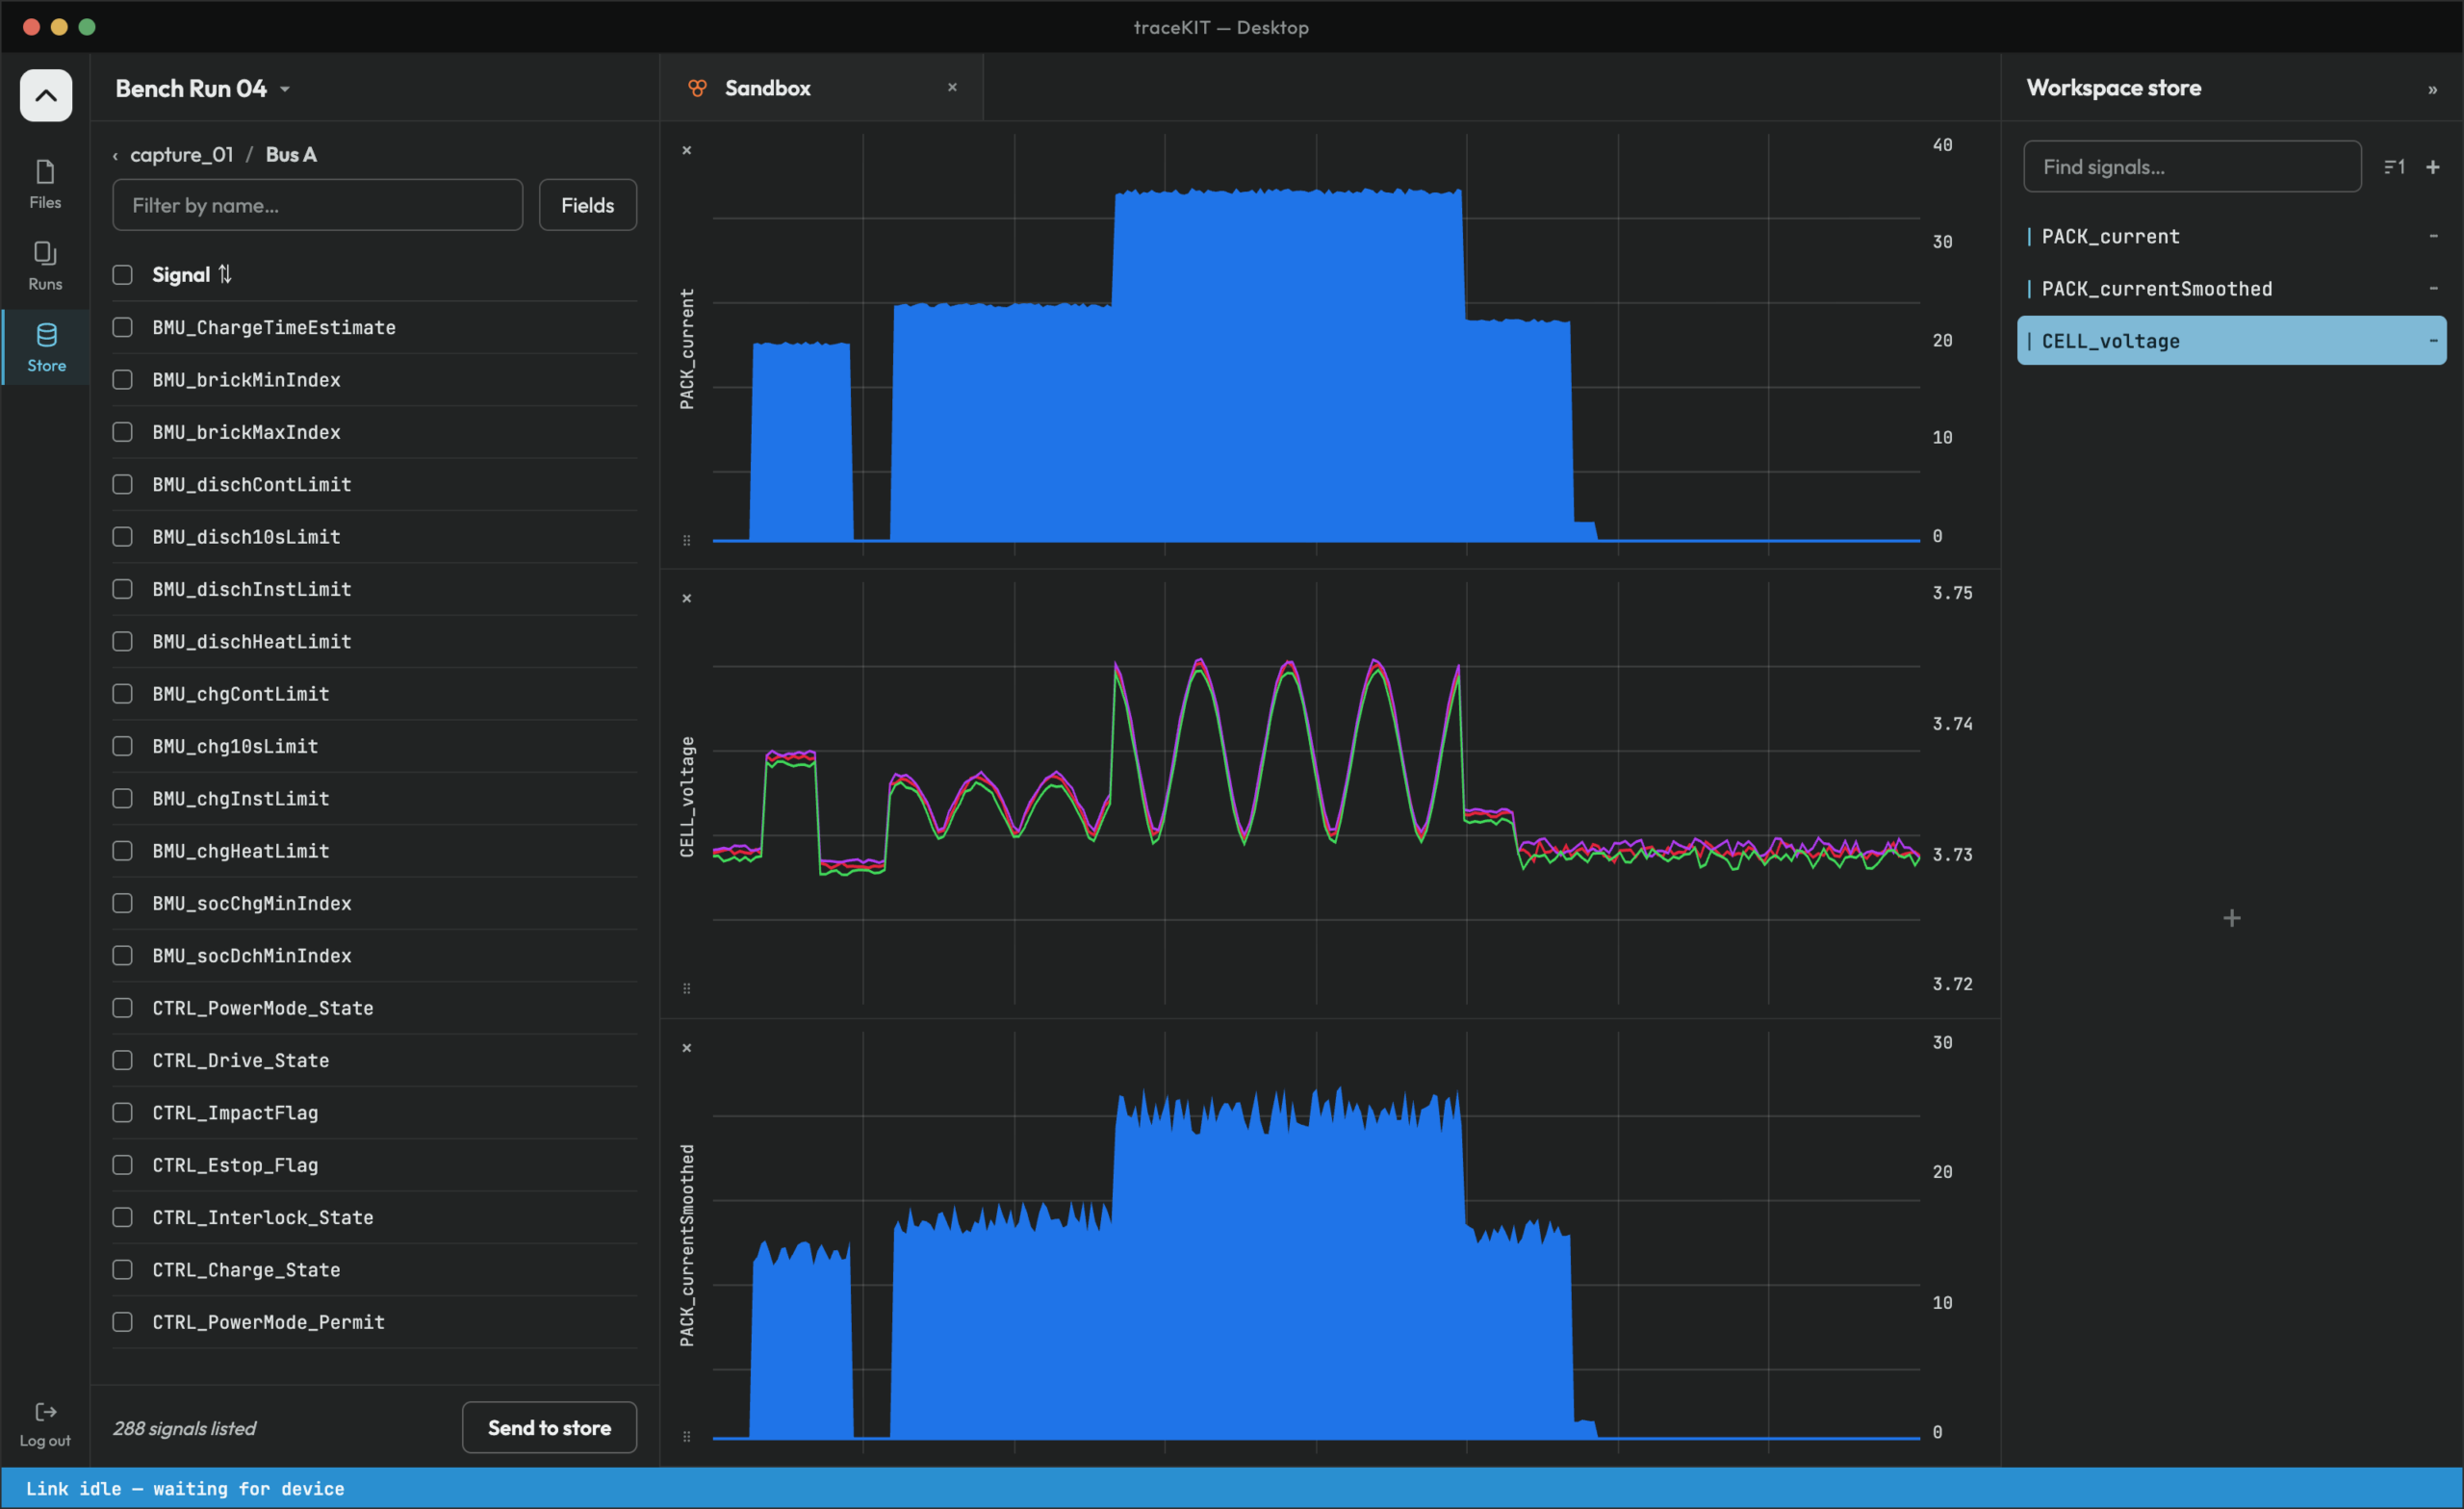
Signal store + Workspace — The core search-to-plot pattern: filtering a 288-signal store into an active workspace. Synchronized multi-track view with a shared time cursor.
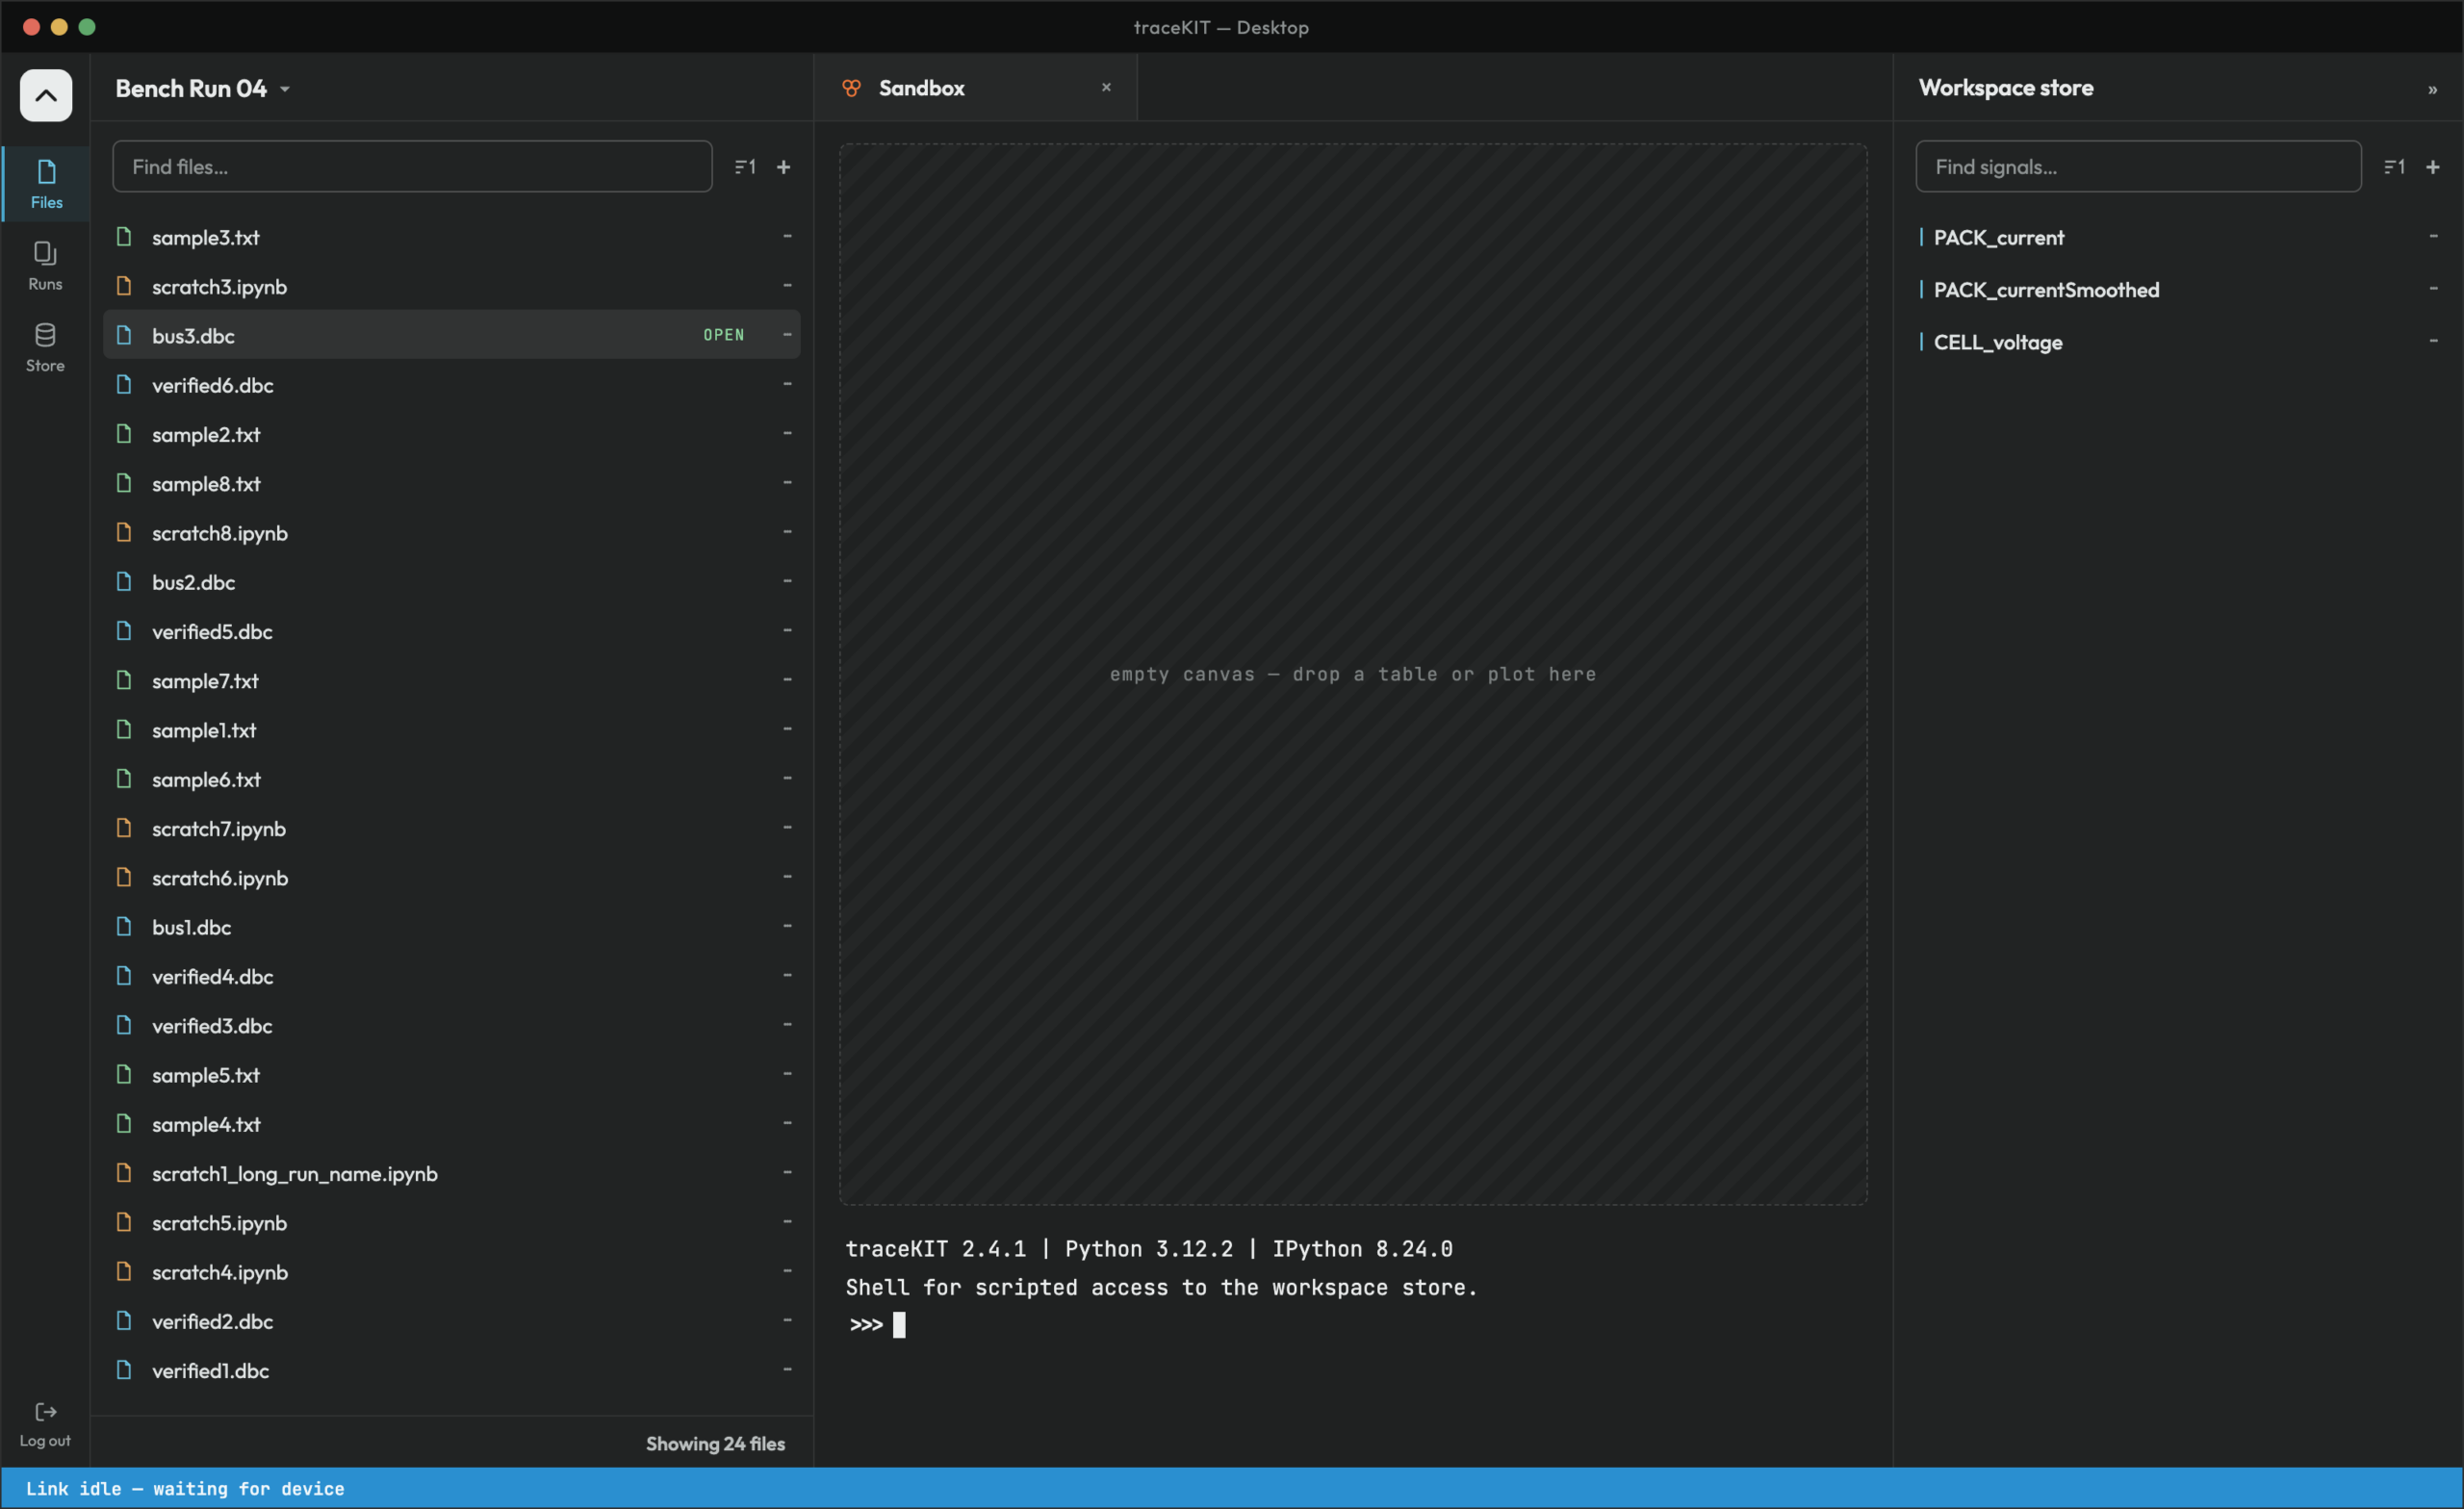
Files + sandbox — An embedded shell for engineers who need to script directly against captured data.
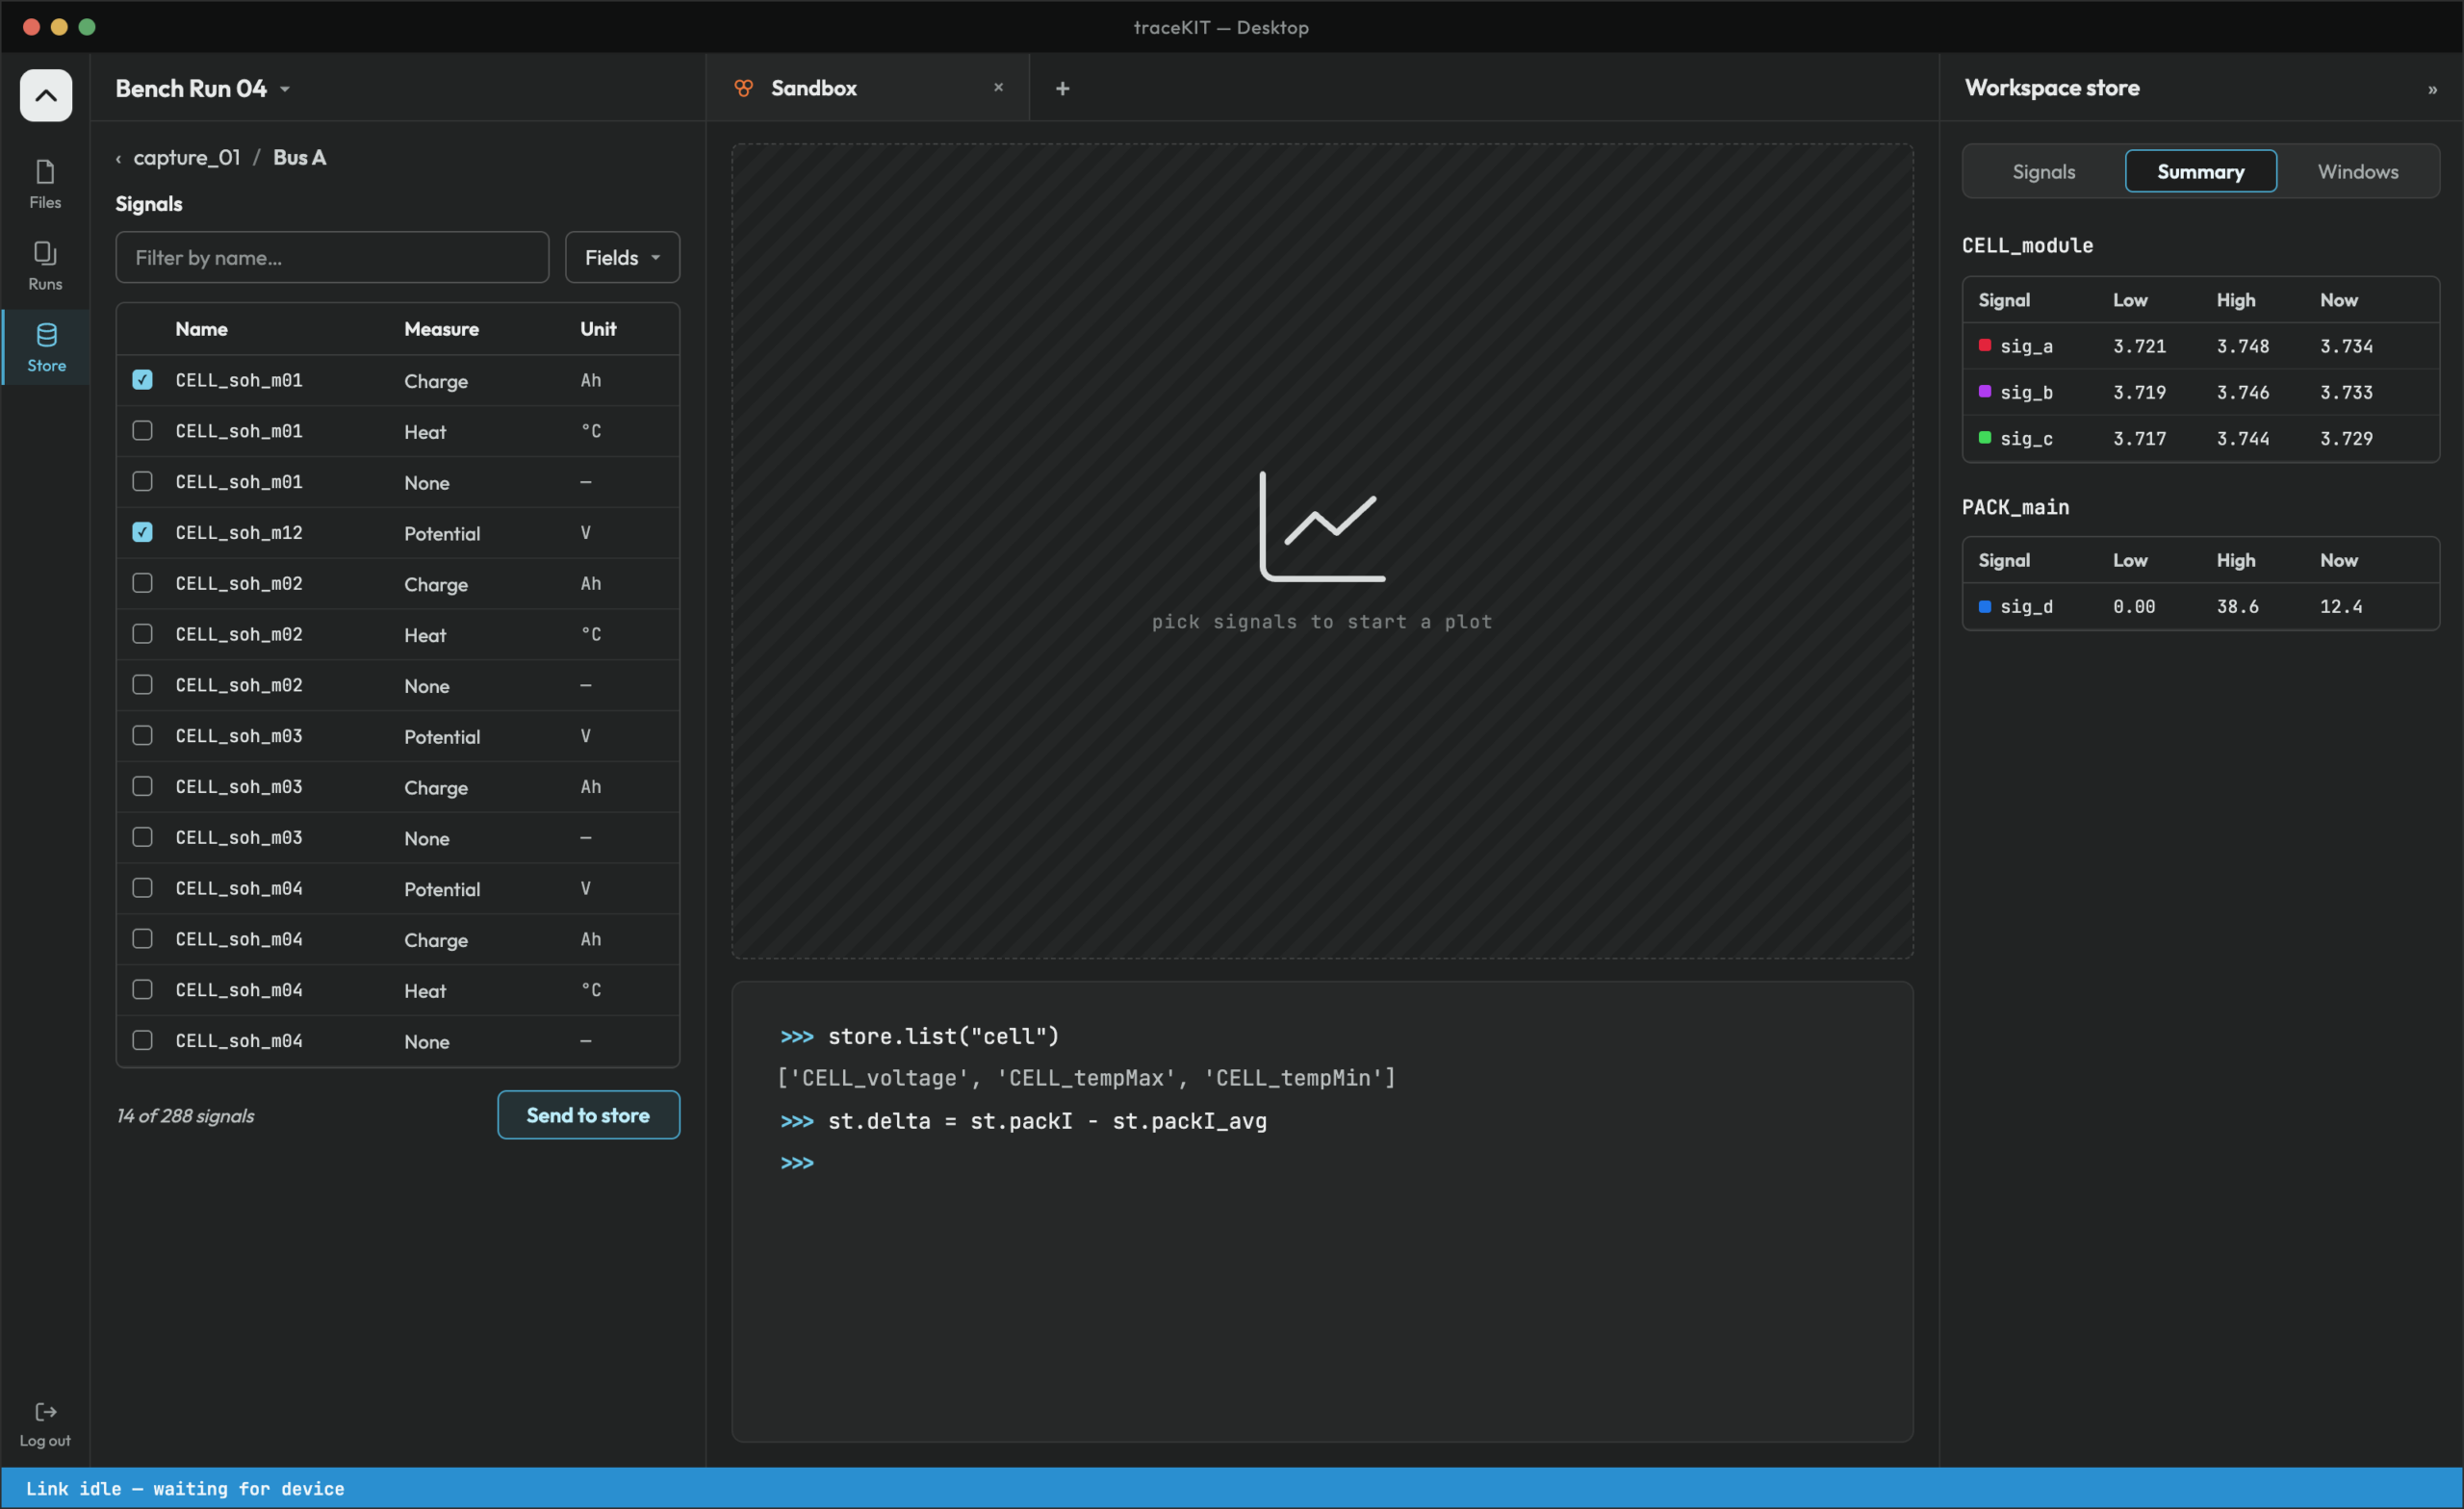
Signal screen lets you pick signals from a recording, run commands on them in a code console, and see their low, high and current values in the summary panel.
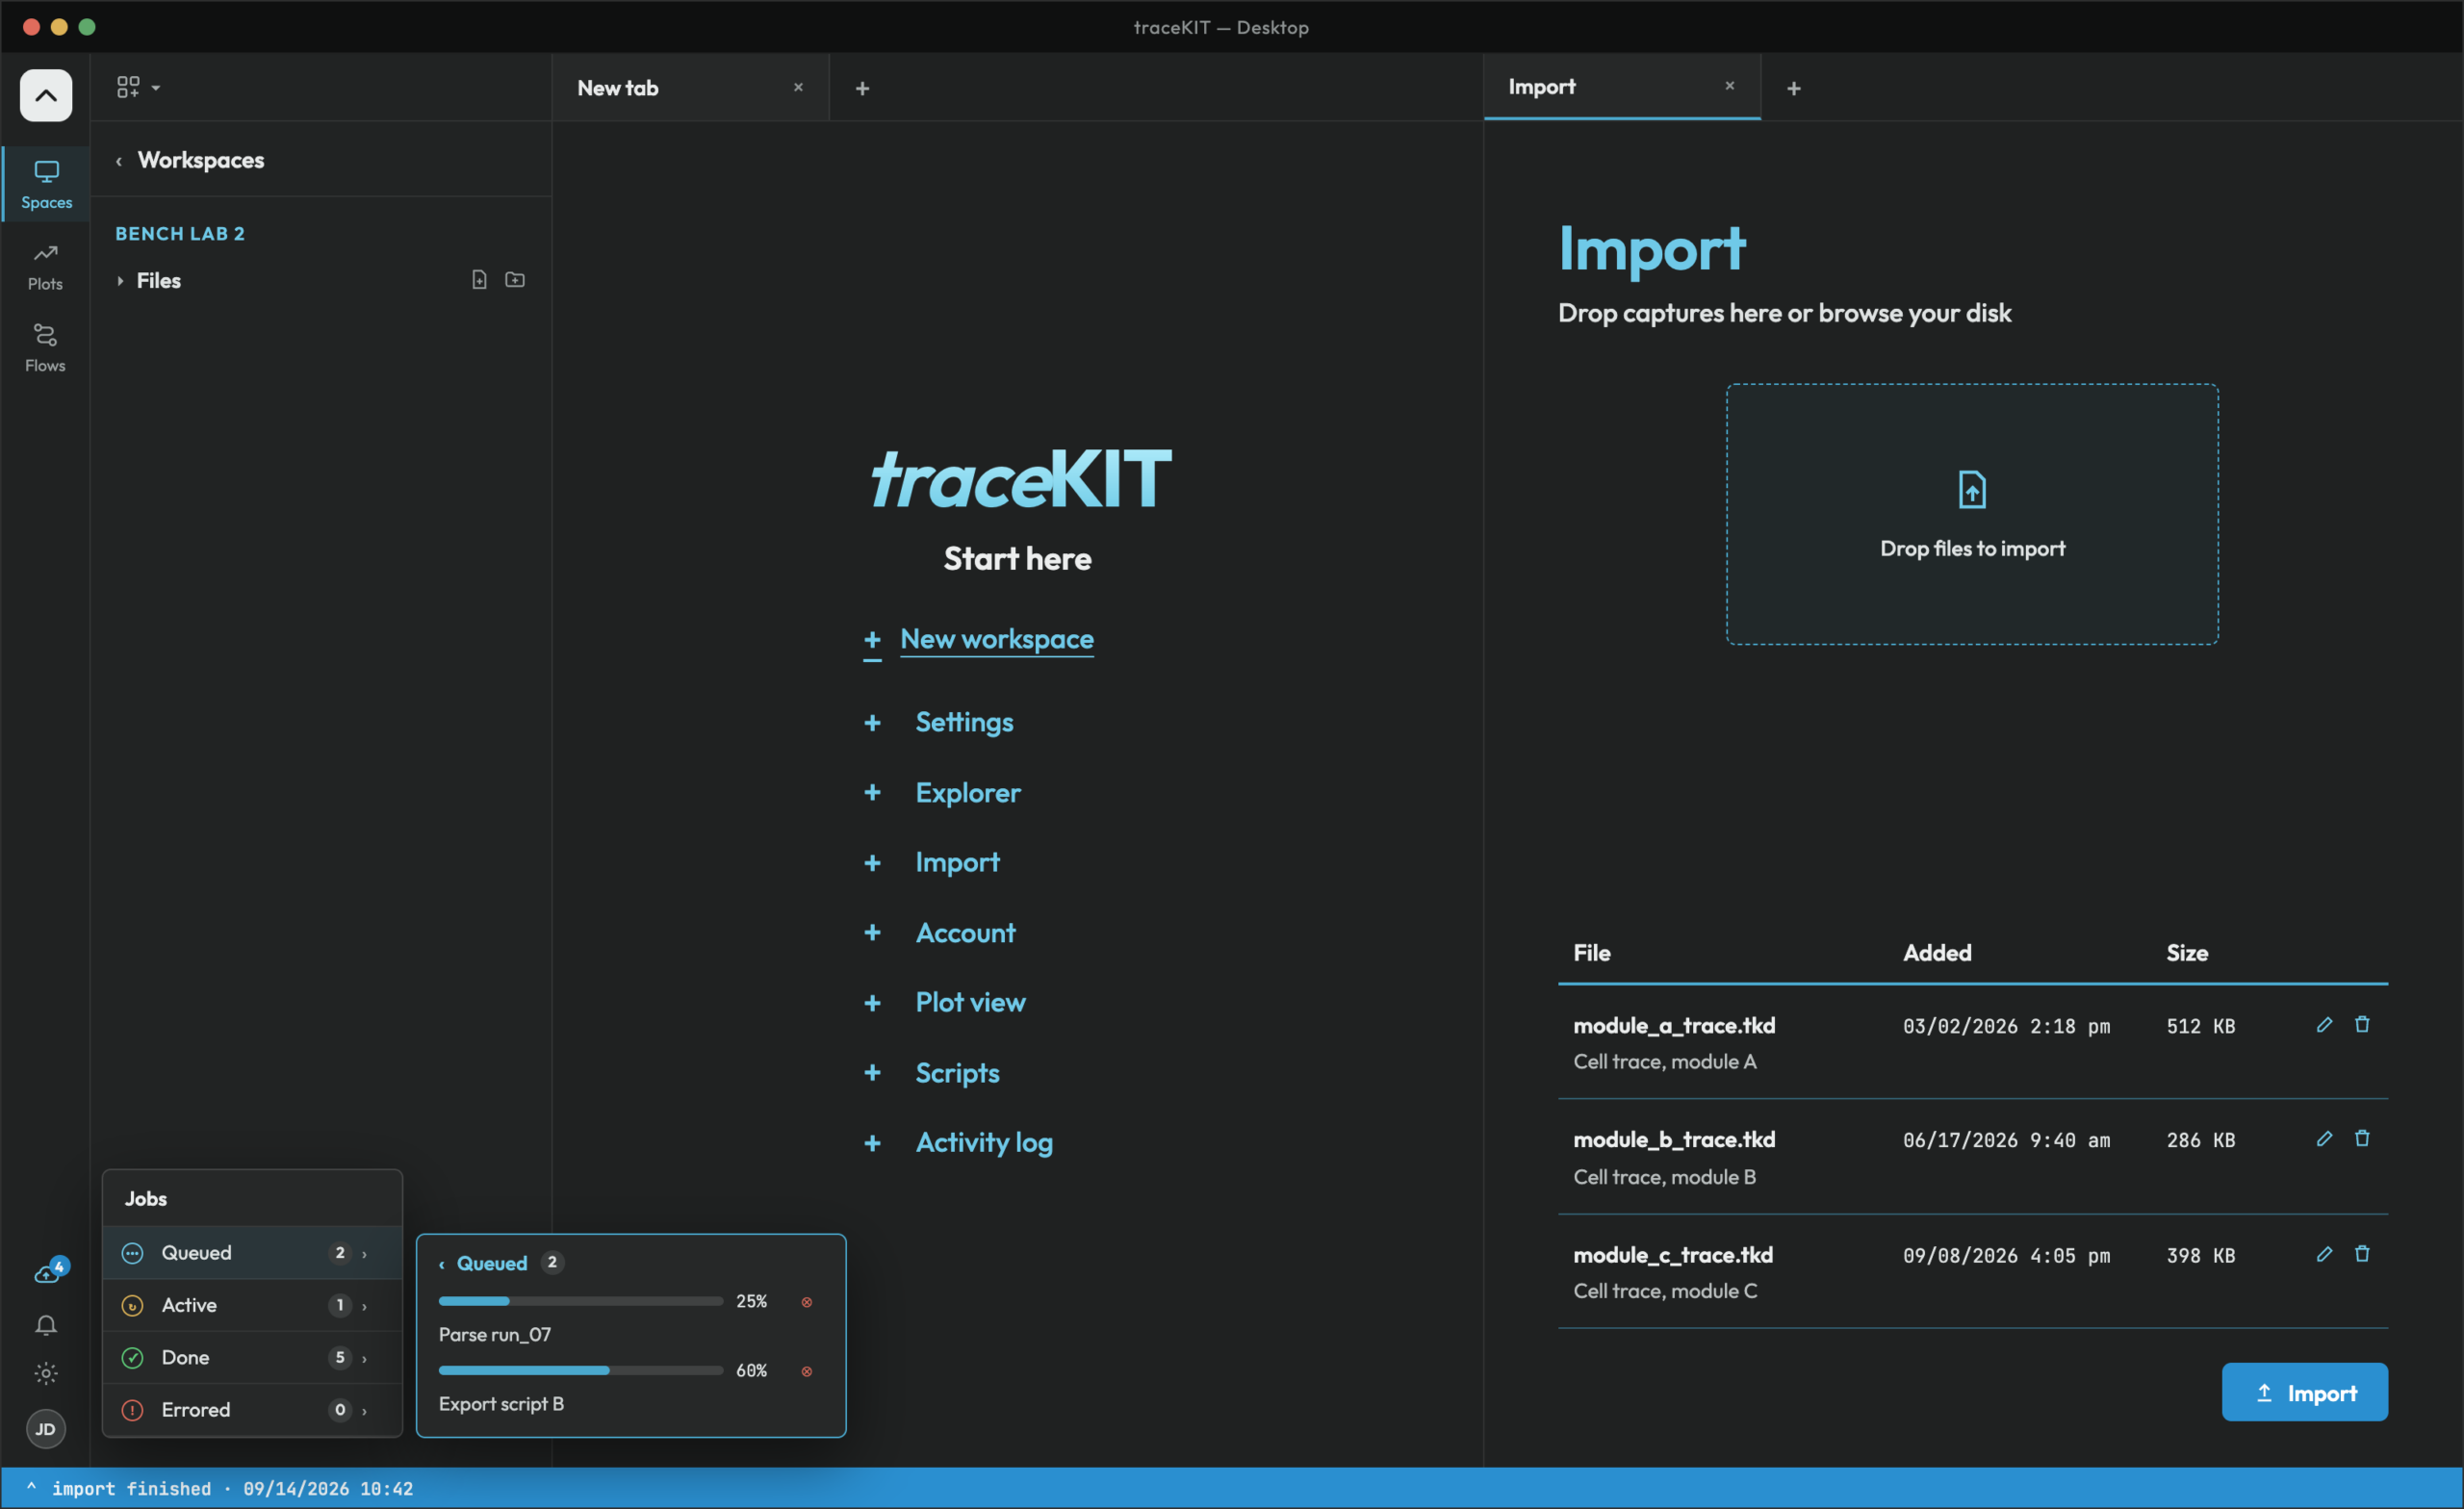
Screen where you start in traceKIT: open a workspace or tool from the launcher, drop recordings in to import them, and follow import progress in the Jobs pop-up.


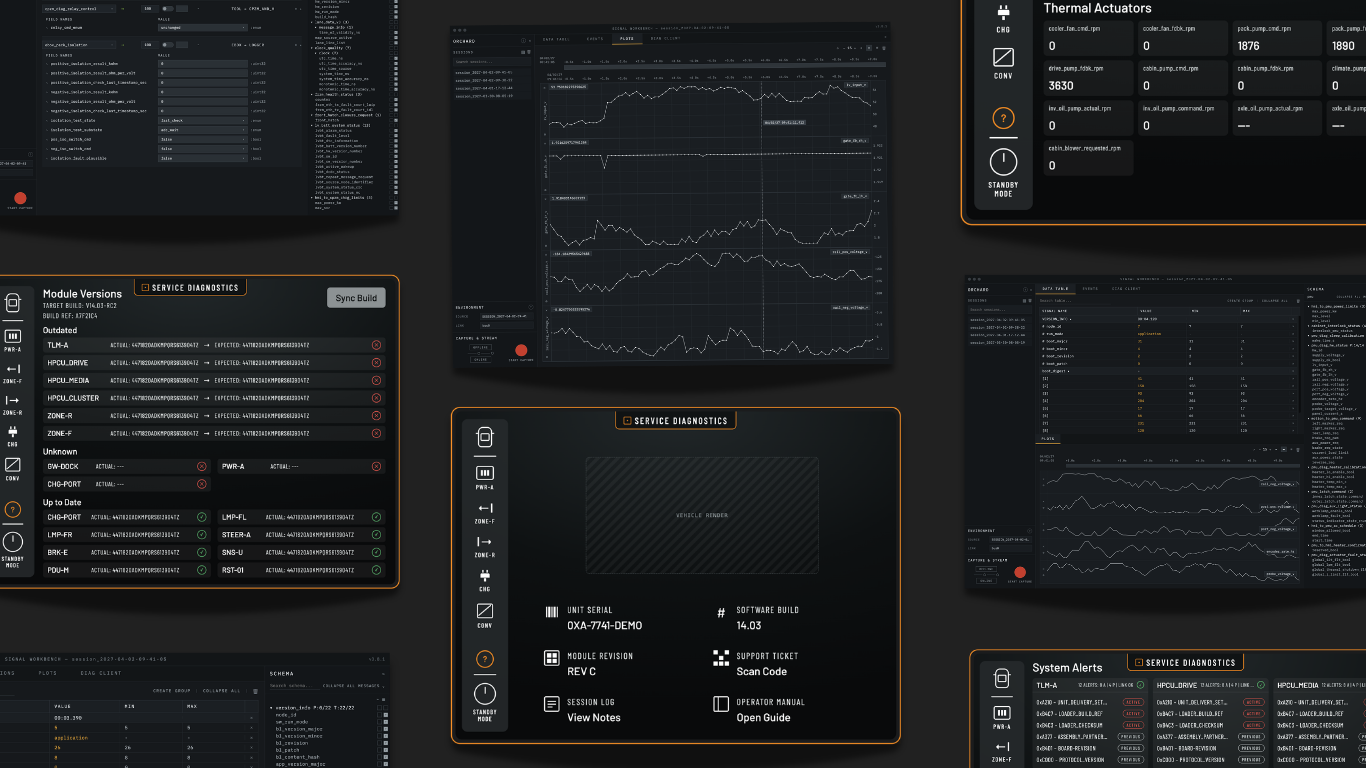
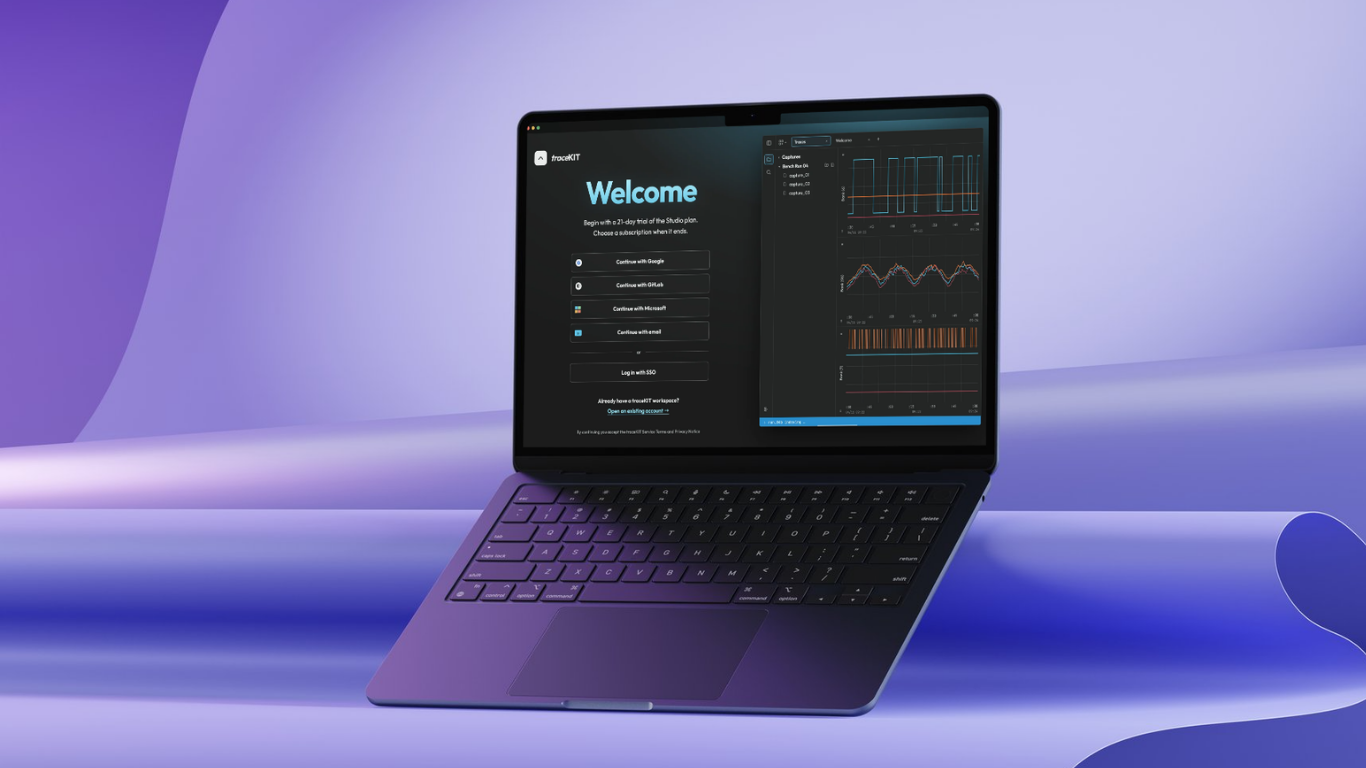
Design is so simple - that's why its so complicated.
© 2026 - 2027